DevOps Productivity Metrics
Measure what matters. In the evolution of DevOps and software engineering, the focus has shifted from counting lines of code or hours worked to measuring outcomes, flow, and satisfaction.
This guide explores the primary frameworks for understanding and improving engineering performance: DORA, SPACE, DevEx, and DX Core 4.
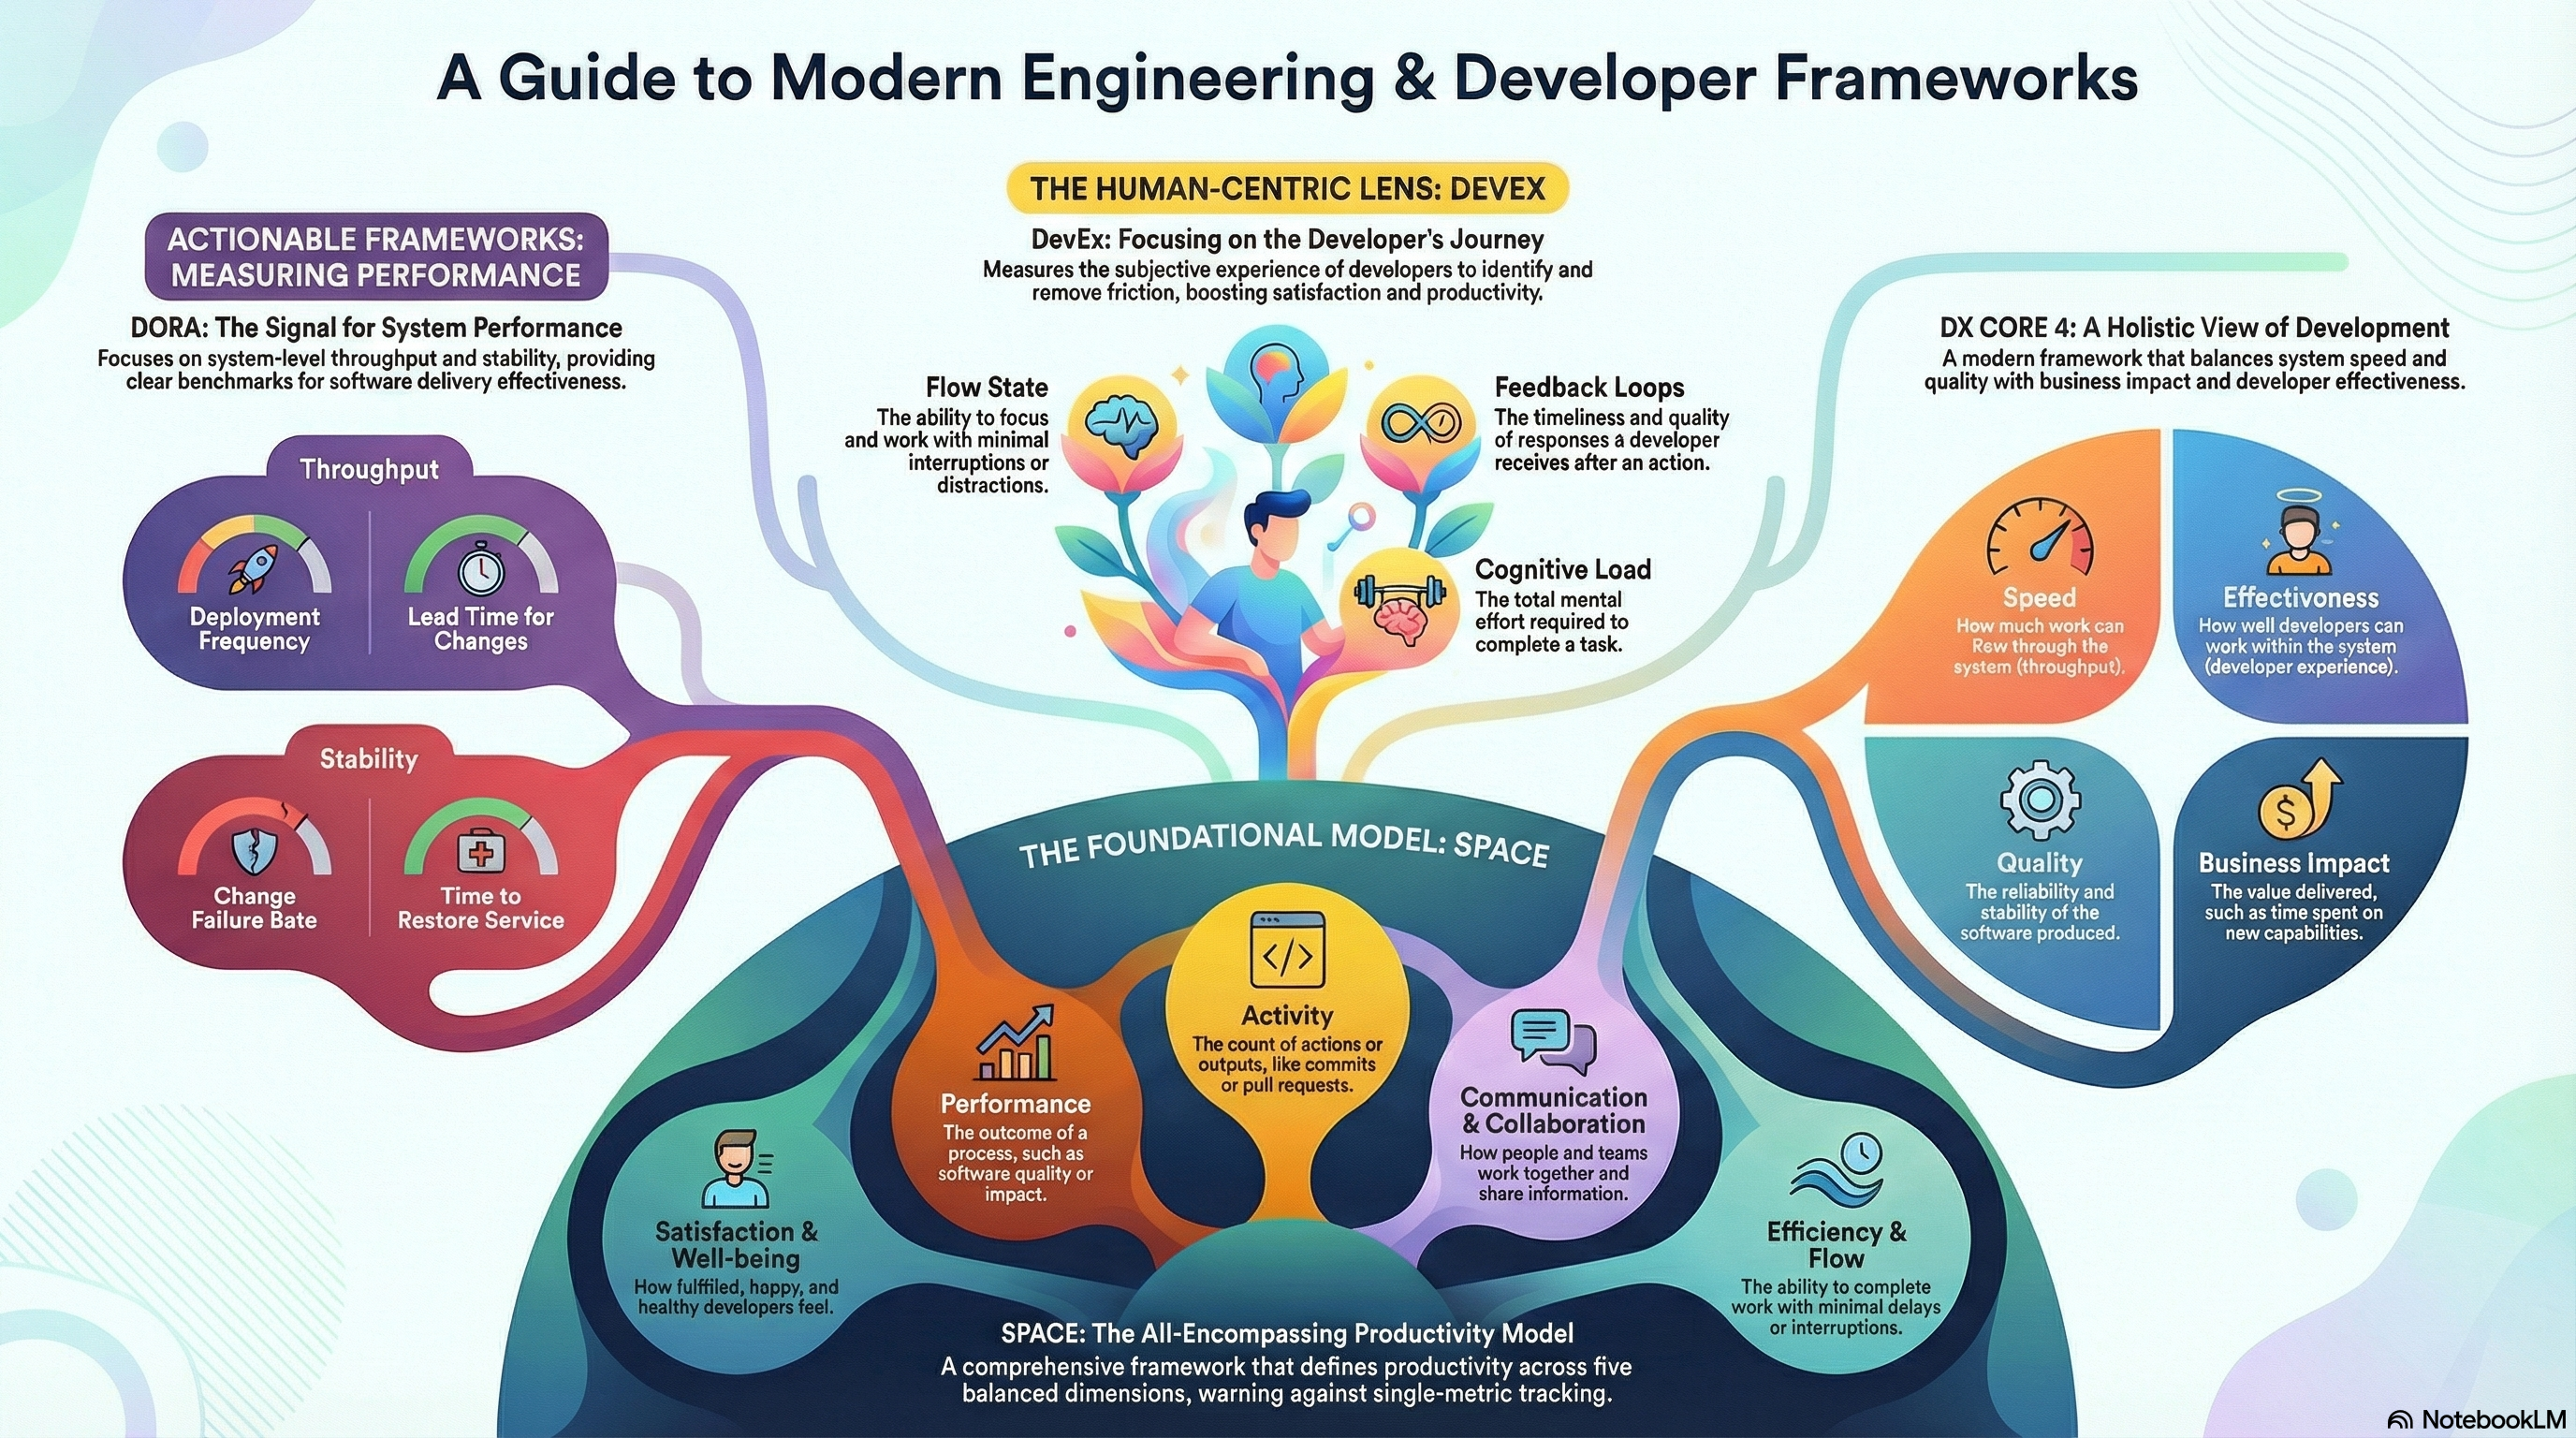 Figure 1: A holistic view of modern engineering frameworks, illustrating the relationship between DORA (System Signals), SPACE (Foundational Model), DevEx (Human-Centric Lens), and DX Core 4 (Holistic Business View).
CAUTION
Golden Rule: Measure Teams, Not Individuals These frameworks are designed to measure system, team, and organizational health. Using them to track individual developer targets (e.g., “ranking developers by commit count”) is a dangerous anti-pattern. It destroys psychological safety, encourages “gaming” the metrics (e.g., writing smaller, meaningless commits), and ultimately degrades performance.
1. DORA: The Signals for System Performance
The DORA (DevOps Research and Assessment) metrics are the industry standard for measuring the throughput and stability of your software delivery process. They are considered “lagging indicators” that reveal the outcome of your engineering practices.
They act as the vital signs of your delivery pipeline.
The Four Keys
- Deployment Frequency (Throughput): How often an organization successfully releases to production.
- Lead Time for Changes (Throughput): The amount of time it takes a commit to get into production.
- Change Failure Rate (Stability): The percentage of deployments causing a failure in production (e.g., needing a hotfix or rollback).
- Time to Restore Service (Stability): How long it takes to recover from a failure in production.
Performance Levels (Benchmarks)
DORA research classifies organizations into four clusters based on these metrics. Moving up these levels is a concrete goal for improvement.
| Metric | Elite Performers | High Performers | Medium Performers | Low Performers |
|---|---|---|---|---|
| Deployment Frequency | On-demand (multiple/day) | Once/week - Once/month | Once/month - Once/6 months | < Once/6 months |
| Lead Time | < 1 Hour | 1 day - 1 week | 1 month - 6 months | > 6 months |
| Time to Restore | < 1 Hour | < 1 day | 1 day - 1 week | > 1 week |
| Change Failure Rate | 0-15% | 0-15% | 0-15% | 46-60% |
NOTE
Elite performers deploy code to production constantly and can restore service in minutes if something breaks. This agility allows them to experiment faster and deliver value with less risk.
2. SPACE: The Foundational Model
While DORA focuses on the delivery pipeline, the SPACE framework (developed by GitHub, Microsoft, and UVic) provides a much broader view of developer productivity.
Why start with DORA if SPACE is foundational?
Organizations often start with DORA because it offers immediate, automated “vital signs” of the system. SPACE is the deeper “anatomy” that explains why the vital signs are healthy or failing. DORA is the alert; SPACE is the diagnosis.
The 5 Dimensions & Applied Examples
| Dimension | System Signals (Observability & Tools) | Qualitative Signals (Surveys) |
|---|---|---|
| S - Satisfaction | Hard to measure via system. (Potential proxy: Turnover rate from HR systems) | eNPS (“How likely are you to recommend working here?”), Burnout index (“I feel emotionally drained from my work”). |
| P - Performance | Reliability (Uptime via Prometheus), Defect Rate (Jira/Sentry), CI Speed (Time to build). | Customer Satisfaction (CSAT), Developer Perception (“I am proud of the code quality we ship”). |
| A - Activity | Commit Volume (Git), Deploy Frequency (CD), Incident Count (PagerDuty). Caution: Context required. | N/A - Activity is best measured by system counts, but value is subjective. |
| C - Collaboration | PR Review Speed (GitHub), Documentation Search Success (Backstage/Confluence logs). | Onboarding Score (“I felt productive within my first week”), Collaboration Friction (“It is easy to get help from other teams”). |
| E - Efficiency | Build Wait Time (CI logs), Context Switching (IDE instrumentation - rare). | Flow State Frequency (“I have long blocks of uninterrupted time”), Tooling Satisfaction (“Our tools help me move fast”). |
TIP
Combine Both Signals: System signals tell you what happened (e.g., PRs are slow). Qualitative signals tell you why (e.g., “We wait days for architecture approval”).
Survey Best Practices
Since ~50% of SPACE relies on asking developers, how you survey matters:
- Frequency: Quarterly is the sweet spot. Frequent enough to track trends, infrequent enough to avoid “survey fatigue.”
- Population: Survey everyone (Census) to get a full picture, or use Random Sampling for large organizations (>1000 devs).
- Anonymity: Aggregated results only. If devs fear retaliation for saying “I’m burned out”, the data is useless.
- Golden Rule: Never ask a question you aren’t prepared to act on. Surveying without action destroys trust faster than not surveying at all.
TIP
To use SPACE effectively, pick one metric from at least three different dimensions. This ensures a balanced view and prevents gaming the system.
3. DevEx: The Human-Centric Lens
DevEx (Developer Experience) zooms in on the subjective experience of the developer. It argues that productivity is a byproduct of a good environment. If you remove friction, productivity follows.
The Core Pillars in Practice
- Flow State: The ability to get into the “zone.” Can developers work with minimal interruptions?
- Goal: Maximize uninterrupted coding time.
- Killer: “Death by meetings” or “Slack-driven development”.
- Feedback Loops: How fast and accurate is the response to an action?
- Goal: Shorten the loop. If a test takes 20 mins, I context switch. If it takes 2s, I stay in flow.
- Tools: Fast local environments, rapid CI, instant linting in IDE.
- Cognitive Load: The amount of mental effort required to complete a task.
- Goal: Simple, intuitive interfaces (Platform Engineering).
- Killer: Having to memorize complex CLI flags, undocumented legacy systems, or navigating 10 wikis to deploy a service.
4. DX Core 4: A Holistic View
The DX Core 4 is a modern synthesis that aligns engineering metrics with business goals.
Why DX Core 4? The ROI Bridge
While DORA measures the pipe and SPACE measures the developer, DX Core 4 measures the Business ROI. It answers the executive question: “We are deploying faster (DORA) and developers are happy (SPACE), but are we actually making money?”
It forces engineering leaders to prove that their technical improvements map directly to business results (Quadrant 4).
The 4 Quadrants & How to Measure Them
1. Speed (Velocity)
How fast is work moving through the system?
- Concrete Measures:
- DORA: Deployment Frequency and Lead Time.
- Cycle Time: Time from first commit to deployment.
- Diff Size: Smaller diffs usually indicate higher speed and lower risk.
2. Effectiveness (Ease of Delivery)
How efficient and friction-free is the developer experience?
- Concrete Measures:
- Perceived Productivity (Qualitative): Measured via Developer Surveys (e.g., quarterly).
- Method: Ask “I am able to complete my work with minimal friction” on a 1-5 Likert scale.
- Why: Self-reported data is often the most accurate predictor of actual productivity for creative work.
- Time spent on “undifferentiated heavy lifting”: ratio of time spent on infrastructure/compliance vs. building features.
- Onboarding Time: Time to 10th PR for a new hire.
- Perceived Productivity (Qualitative): Measured via Developer Surveys (e.g., quarterly).
3. Quality (Stability)
Is the software reliable and meeting standards?
- Concrete Measures:
- DORA: Change Failure Rate and Time to Restore Service.
- Incident Count: Number of SEV1/SEV2 incidents per month.
- Defect Escape Rate: Bugs found in production vs. found in testing.
4. Business Impact (Value)
Is the engineering effort driving business results?
- Concrete Measures:
- Innovation Ratio: Percentage of effort spent on New Features vs. Maintenance (KTLO).
- How: Tag tickets in Jira/Linear as “Kapital” vs “Expense” (or Feature vs Bug) and sum the story points/hours.
- Feature Adoption Rate: Percentage of users using a newly shipped feature after 30 days.
- How: Product Analytics (e.g., Amplitude, Mixpanel). If you ship it and nobody clicks it, engineering was “efficient” but “ineffective”.
- Cost Efficiency: Cloud cost per transaction or per user.
- How: FinOps data (AWS Cost Explorer) divided by System Load.
- Innovation Ratio: Percentage of effort spent on New Features vs. Maintenance (KTLO).
IMPORTANT
Business Impact is often the missing link. Engineering teams must prove that “shipping faster” (Speed) actually results in “better business outcomes” (Impact). High speed with zero adoption is waste.
Synthesis: How They Connect
These frameworks are not mutually exclusive; they layer together to tell a complete story:
| Layer | Framework | Role | Type of Indicator |
|---|---|---|---|
| Holistic / Strategic | DX Core 4 | Balances engineering health with business impact. | Strategic |
| Outcomes / System | DORA | Measures the result of your delivery capability. Signals if key systems are fast and stable. | Lagging |
| Human / Experience | DevEx | specific focus on friction and satisfaction. Drives the outcomes. | Leading |
| Foundation | SPACE | The comprehensive map. Ensures you aren’t ignoring key areas like collaboration or well-being. | Foundational |
Implementation Pattern: The “Metrics Sandwich”
- Start with DORA: Automate the collection of the 4 keys to get a baseline of your delivery health.
- Layer in DevEx Surveys: regularly ask developers about Flow, Feedback, and Cognitive Load. This tells you why your DORA metrics might be lagging.
- Map to SPACE: Use SPACE to ensure you aren’t over-optimizing (e.g., high Deployment Frequency but burning out the team → Low Satisfaction).
Tools & Resources
Official References
- DORA Research Program - The official home of the State of DevOps Reports.
- The SPACE of Developer Productivity (ACM Queue) - The original research paper defining SPACE.
- DevEx: What Actually Drives Productivity (ACM Queue) - The seminal paper on DevEx.
- DX Core 4 Whitepaper - Introduction to the Core 4 framework.
Tools
- Four Keys (Google Cloud): Open source project to measure DORA metrics from GitHub/GitLab data.
- Developer Portals (e.g., Backstage): Often used to visualize these metrics and reduce cognitive load.
- Surveys: The most effective tool for DevEx and SPACE (Satisfaction) metrics.